
Оставить заявку
Для заказа и получения более подробной информации оставьте заявку, наш менеджер свяжется с Вами!
Нажимая на кнопку, вы даете согласие на обработку персональных данных и соглашаетесь c политикой конфиденциальности
Недорогая платформа для автоматизированной съёмки с открытым исходным кодом
Max R. Lien¹, Richard J. Barker², Zhiwei Ye¹, Matthew H. Westphall¹, Ruohan Gao¹, Aditya Singh³, Simon Gilroy² и Philip A. Townsend¹*
* Для корреспонденции: ptownsend@wisc.edu. ¹ Russell Labs, Висконсинский университет в Мадисоне, 1630 Linden Drive, Мадисон, WI 53706, США. Полные сведения об авторах приведены в конце статьи.
Lien и др. Plant Methods (2019) 15:6
https://doi.org/10.1186/s13007-019-0392-1
Методология · Открытый доступ
Аннотация
Предпосылки. Дистанционный мониторинг растений методом гиперспектральной съёмки стал важным инструментом изучения их роста, развития и физиологии. Многие приложения рассчитаны на полевые условия и позволяют неразрушающим способом анализировать реакции культур на засуху, дефицит питательных веществ и болезни, например с помощью приборов на рельсовых платформах, беспилотниках или самолётах. В поле действует множество неконтролируемых факторов среды, которые осложняют проверку и интерпретацию спектрального отклика. Поэтому растёт интерес к лабораторным и тепличным системам исследования и фенотипирования растений. В этой работе мы спроектировали и разработали HyperScanner — открытую систему гиперспектральной съёмки в отражённом свете для лабораторных экспериментов с растениями. Надёжность и точность HyperScanner проверили в экспериментах по засушливому и солевому стрессу у Arabidopsis thaliana.
Результаты. Создана устойчивая, масштабируемая и надёжная система. Она собрана из компонентов с открытой документацией. Все оригинальные детали, процедуры эксплуатации и данные опубликованы в соответствии с принципом открытости HyperScanner. Полученные изображения коэффициента отражения показали изменения в узких полосах красного и инфракрасного диапазонов при обоих видах стресса. Изменения проявлялись до других видимых физиологических реакций и согласовывались с измерениями контактными спектрометрами полного диапазона.
Заключение. HyperScanner позволяет создать надёжную и недорогую лабораторную систему гиперспектральной съёмки. Система быстро получала точные кривые отражения в разных опытах со стрессом растений. Изображения выявляли спектральные различия вскоре после начала воздействия и до появления видимых изменений. Повышая доступность гиперспектрального анализа в лабораториях, HyperScanner расширяет возможности аналитических методов на основе спектроскопии и изображений.
Ключевые слова: автоматизация, гиперспектральная съёмка, открытый исходный код, спектроскопия изображений, неинвазивный метод, отражение, Arabidopsis, низкая стоимость.
© Авторы, 2019. Статья распространяется по международной лицензии Creative Commons Attribution 4.0 (http://creativecommons.org/licenses/by/4.0/). Лицензия разрешает использование, распространение и воспроизведение на любом носителе при условии указания авторов и источника, ссылки на лицензию и сведений о внесённых изменениях. В отношении данных статьи действует отказ от авторских прав Creative Commons Public Domain Dedication (http://creativecommons.org/publicdomain/zero/1.0/), если не указано иное. В этом документе представлен перевод статьи на русский язык.
Предпосылки
Дистанционный мониторинг физиологии и биохимии растений имеет большой потенциал для понимания их роста и развития в условиях от лаборатории до поля [1]. Спектроскопия отражения быстро становится эффективным и практичным способом оперативной неразрушающей оценки различных химических, биофизических и метаболических признаков в живых тканях растений [2]. Метод использует различия оптических свойств листьев, обусловленные взаимодействием света с химическими связями [3, 4]. Например, измерения спектральных особенностей поглощения и отражения в видимой и инфракрасной областях (примерно 400–2500 нм) применяют для непосредственной оценки структуры листьев, химического состава растения, содержания воды и состояния обмена веществ [5–9]. Некоторые особенности спектров известны как признаки конкретных химических процессов или реакций на стресс. Примером служит выявление физиологического стресса по фотохимическому индексу отражения [10–13]. Спектры остаются богатым источником информации для исследований и фенотипирования растений. Из них потенциально можно извлечь многие дополнительные показатели физиологии и химического состава [14, 15].
Несмотря на большой потенциал спектроскопических методов съёмки, их применение пока ограничивает ряд практических трудностей [1]. Например, организовать многократные спектроскопические измерения большого числа образцов во многих временных точках сложно и порой чрезмерно затратно по времени, особенно в поле, где на измерения влияет переменное освещение [16]. Это важно при анализе реакций растений, поскольку они могут быстро меняться под действием факторов среды или биотического стресса, что требует сбора временных рядов, и сильно различаться между видами или генотипами, что требует обследования многих растений. Для решения этих проблем исследователи и частные компании разработали установки, автоматизирующие большую часть или весь процесс съёмки [17–22].
Наиболее широко гиперспектральная съёмка применяется с датчиками на беспилотниках или небольших самолётах [23, 24]. Сравнительно недавно появились и стационарные установки для сканирования неподвижных участков или объектов [1, 17, 25, 26]. Обычно прибор закрепляют в оптимальном положении, и ось с моторным приводом перемещает растения, подлежащие сканированию, либо перемещают сам прибор. Установкой управляет программа, принимающая команды пользователя на перемещение и управление прибором. Неинвазивность гиперспектральной съёмки позволяет получать информативные данные при повторных измерениях, однако существенные недостатки таких установок сильно ограничивают их доступность для многих исследователей растений [27].
Основные ограничения стационарных установок — высокая стоимость, зачастую сложная конструкция и сравнительно большие габариты. Всё это затрудняет использование в лаборатории [28]. Например, Lab Scanalyzer компании LemnaTec GmbH имеет прочную конструкцию и позволяет гибко выбирать датчики, но для большинства исследователей его стоимость слишком высока [29]. Field Scanalyzer подходит для полевых исследований, однако он ещё дороже, требует команды для сборки и применим лишь на больших участках посевов [18]. Исследователи создавали собственные установки для аналогичного неинвазивного анализа, но недостаток технических сведений делает эти платформы малодоступными и затрудняет их воспроизведение другими группами. Кроме того, различия в конструкции затрудняют сравнение или воспроизведение результатов разных работ [6, 30–33].
С появлением открытых электронных платформ и компонентов для самостоятельной сборки создавать такие установки стало проще. Всё доступнее качественные, недорогие и хорошо документированные инструменты. Недорогая электроника и адаптируемые материалы, в том числе детали, изготовленные на 3D-принтере, дали начало новым видам лабораторного оборудования [34, 35]. Открытость таких разработок также упрощает обмен ими [36, 37].
В этой работе мы создали HyperScanner — неинвазивную лабораторную систему гиперспектральной съёмки (рис. 1a). Большинство коммерческих спектрометров не имеют открытой документации, однако сама платформа HyperScanner целиком основана на доступных открытых системах и изделиях. Для её создания мы объединили существующий открытый станок с числовым программным управлением (ЧПУ, CNC) X-Carve с программным обеспечением собственной разработки [38]. При наличии подходящего прибора стоимость платформы без формирующего изображение спектрометра составляет менее 3000 долл. США.
Аппаратное и программное обеспечение HyperScanner можно адаптировать к конкретным протоколам с минимальными затратами времени и усилий. Большая зона сканирования позволяет одновременно исследовать множество растений. Текущая вместимость составляет около 20 стандартных посевных кассет. Сканирование двух кассет, в каждой из которых находится по 18 растений Arabidopsis thaliana, занимает около 5 мин. Конструкция полностью модульная: любую деталь можно переработать для другого датчика или эксперимента [39, 40]. Например, можно изменить размеры крепления и напечатать его заново для другого прибора (рис. 1b). Сейчас используется датчик видимого и ближнего инфракрасного диапазонов (VNIR, 400–1000 нм) Nano Hyperspec (далее Nano) производства Headwall Photonics (Болтон, Массачусетс, США). Можно подключать и другие системы съёмки, чтобы получать более подробные сведения о строении и химическом составе растений для мониторинга их состояния (рис. 1b, c). Задача проекта включала разработку недорогой лабораторной установки и публикацию документации по её сборке и эксплуатации, чтобы сделать такие системы доступнее для исследователей растений. Технические сведения, конструкция и программное обеспечение описаны в разделе «Методы».
Мы проверили HyperScanner при съёмке Arabidopsis в условиях засушливого и солевого стресса. Эти воздействия легко задавать и контролировать [41]. Для Arabidopsis доступны методы количественной оценки состояния растений по RGB-фотографиям, а его реакции на широкий спектр условий среды подробно изучены [42, 43]. Это позволяет интерпретировать спектральные данные HyperScanner в контексте уже известных физиологических, биохимических и молекулярных изменений. HyperScanner выявлял спектральные сдвиги до того, как признаки физиологического повреждения становились заметны на RGB-фотографиях [44] (рис. 1d). При переносе в полевые условия это позволило бы растениеводу или агроному скорректировать условия выращивания либо использовать устойчивые к стрессу сорта для обеспечения стабильной урожайности [45, 46].
Результаты
HyperScanner показал себя как надёжный инструмент, обеспечивающий воспроизводимый сбор данных об отражении. Доступные компоненты с открытой документацией позволили создать модульную конструкцию. Систему можно изменять и адаптировать к разным датчикам и экспериментам. В нашем случае положение креплений осветителей оптимизировали для эффективного освещения Arabidopsis (рис. 1b). Разработанное нами программное обеспечение обеспечило надёжную работу и удобное управление установкой.
В течение 19 дней растения выращивали для последующего стрессового воздействия и гиперспектрального анализа. Ежедневно проводили интервальную RGB-съёмку 8-мегапиксельной камерой Raspberry Pi Camera V2 (Adafruit, Нью-Йорк, США). Морфологические различия по мере роста отслеживали по серии фотографий с использованием пакета Phenotiki [42] (рис. 2a).
На 19-е сутки контрольные растения полили водой. Для создания осмотического и ионного стресса в солевой вариант внесли 2 л 500 мМ раствора NaCl. Для создания засушливого стресса полив прекратили с этого момента. С 13-х суток до последнего сканирования контролировали условия выращивания: массу, влажность и температуру. Данные приведены в дополнительном файле 1.
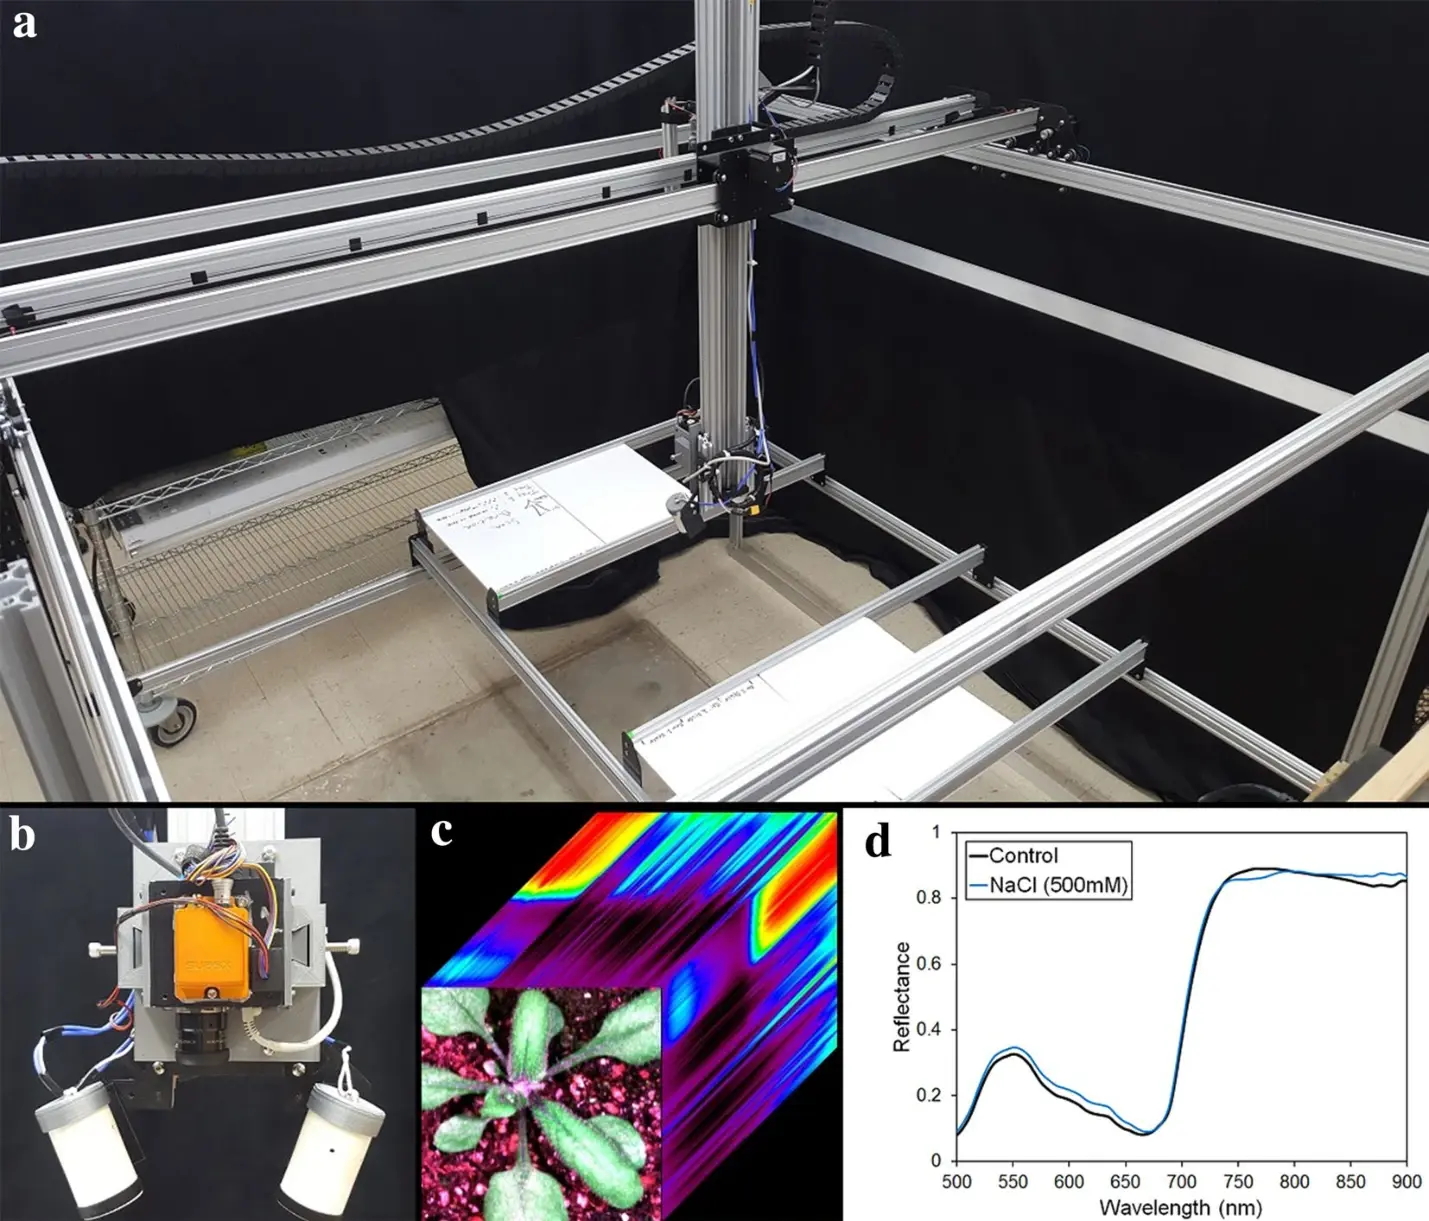
Рис. 1. a — фотография HyperScanner. b — модифицированная подвижная сканирующая головка для эксперимента с плоским листом, оснащённая Headwall Photonics Nano Hyperspec. c — RGB-изображение Arabidopsis с визуализацией гиперспектральных данных. d — спектры в видимой и ближней инфракрасной областях у контрольного растения и растения после солевой обработки через сутки после начала воздействия.
Обозначения на панели d: Reflectance — коэффициент отражения, Wavelength (nm) — длина волны (нм), Control — контроль, NaCl (500 mM) — обработка 500 мМ NaCl.
Результаты морфологического анализа показаны на рис. 2b–d. Оценка морфологических признаков выявила замедление роста при засухе и постепенное уменьшение размеров растений в солевой группе, сопровождавшееся обесцвечиванием листьев (рис. 2a). Видимые признаки стресса в виде тенденций к уменьшению диаметра, периметра и площади розетки обнаруживались через 1–2 суток после начала воздействия (рис. 2a). Статистический анализ показал значимые различия через 1–2 суток после солевой обработки и через 4–6 суток после начала засухи (рис. 2b–d). На 23-и сутки солевой стресс значимо влиял на все признаки, а засуха — только на площадь листьев. Влияние засухи на диаметр и периметр было значимым на 24-е и 25-е сутки соответственно. Таким образом, традиционный морфометрический анализ позволил увидеть различия на 24-е сутки для засухи и на 21-е для солевого стресса.
Гиперспектральное сканирование начали на 20-е сутки, через сутки после начала воздействия, и продолжали до 26-х суток. Изображения энергетической яркости преобразовали в абсолютный коэффициент отражения и выполнили векторную нормализацию. Выделили пиксели растений, из которых для дальнейшего анализа отобрали n = 2000. Кривые отражения на 20-е сутки показали значимые различия между контролем и стрессовыми группами и быстро указали на наличие засушливого или солевого стресса. Данные отражения на 20-е сутки представлены на рис. 3 в виде тепловых карт нормализованного разностного спектрального индекса (NDSI) для всех пар длин волн и результатов t-критерия для каждой длины волны. Тепловые карты коэффициента корреляции r для NDSI показывают статистические тенденции во всех сочетаниях вариантов (рис. 3a). Карты выявили чувствительность к засухе в диапазоне около 700–900 нм, а к солевой обработке — около 500–650, 700–720 и 800–900 нм. Различия между засухой и засолением наблюдаются примерно при 580–650 и 750–800 нм. Каждая пара вариантов имела свои особенности, однако значимые эффекты в области красного края и ближнего ИК-диапазона присутствовали во всех сравнениях.
На рис. 3b приведены p-значения t-критерия, рассчитанные для каждой длины волны при сравнении вариантов по данным отражения на 20-е сутки. На графике десятичных логарифмов p-значений выделяются длины волн, по которым различия между вариантами наиболее значимы. Им соответствуют значения ниже пунктирных линий. Полученные p-значения указывают на конкретные длины волн, на которых отражение изменялось под действием стресса.
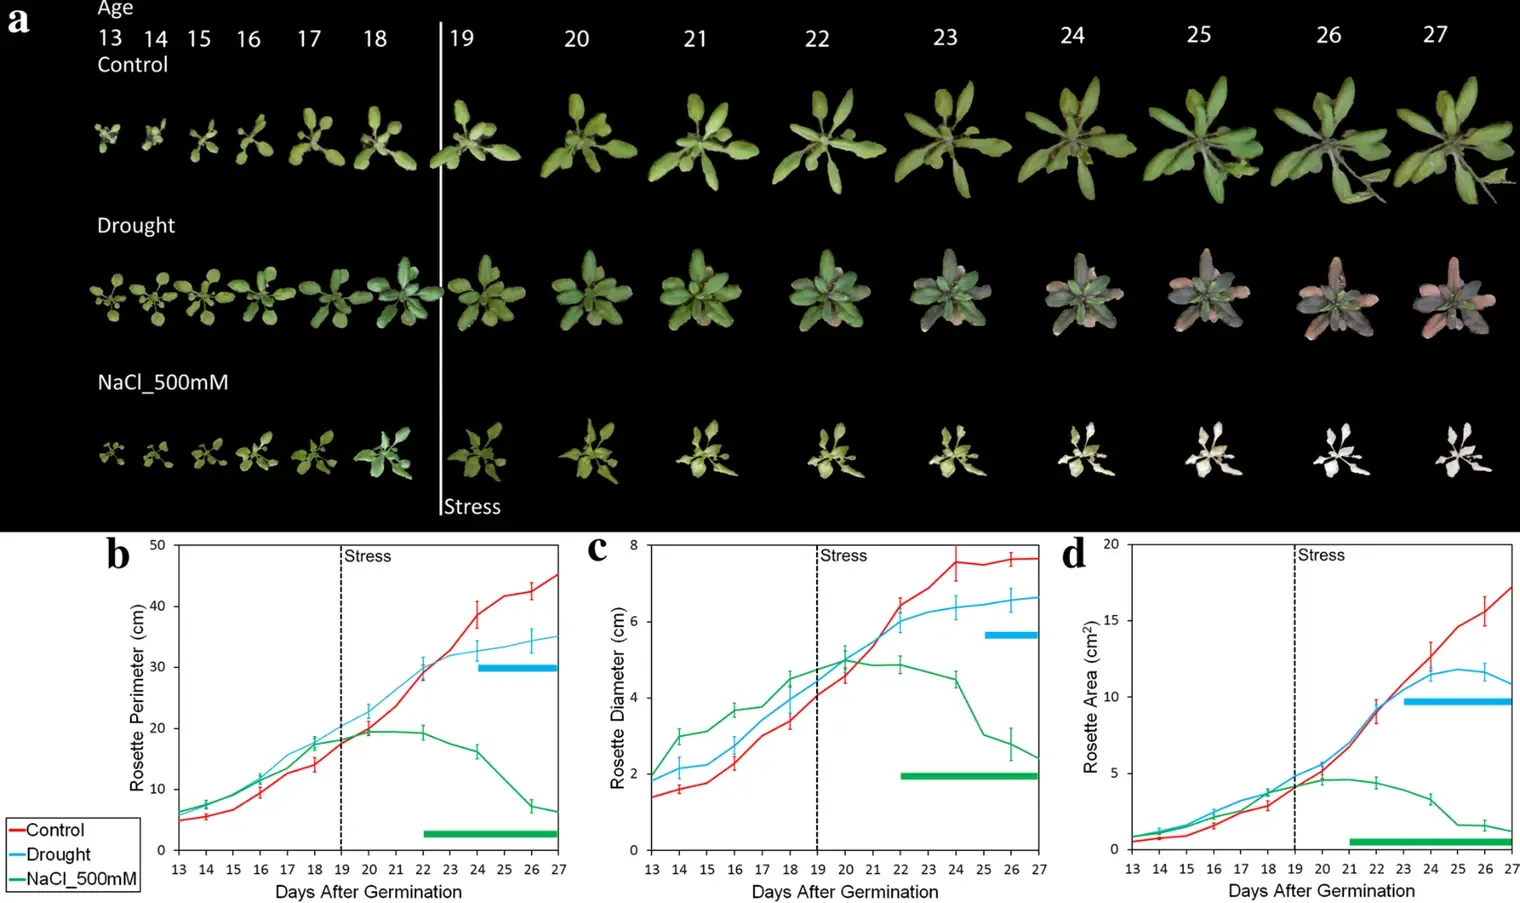
Рис. 2. a — характерные изображения Arabidopsis дикого типа Col-0 при засухе и солевом стрессе (500 мМ NaCl). До воздействия растения выращивали 19 суток. Изображения проанализировали в Phenotiki. b — периметр розетки, c — диаметр розетки, d — площадь розетки. Для b–d показано среднее ± стандартная ошибка (SE), n = 18 повторностей. Полосы отмечают точки, значимо отличающиеся от контроля по t-критерию (p < 0,05).
Обозначения: Age — возраст растения (сутки), Days After Germination — сутки после прорастания, Stress — начало воздействия, Control — контроль, Drought — засуха. Оси ординат: периметр и диаметр розетки (см), площадь розетки (см²).
При каждом попарном сравнении наиболее значимые различия наблюдались при 650–700 нм и после точки перегиба красного края (около 700 нм), менее значимые — при 500–650 нм. У растений при засухе выявлены значимые эффекты в широкой области ближнего ИК-диапазона, связанные со структурой листа или растения. При засолении наблюдались более узкие особенности: в красном диапазоне, связанные с воздействием на хлорофилл, на красном крае (720 нм), обусловленные стрессом, и в нескольких участках ближнего ИК-диапазона, обусловленные изменениями структуры листа. При сравнении двух стрессовых вариантов p-значения также выявили различия в характере реакций растений. В частности, реакции значимо различались в зелёной и красной областях и на красном крае. В зелёном, красном и ближнем ИК-диапазонах влияние засоления было сильнее, а при 770 нм различия были особенно значимыми. Хотя оба воздействия дали значимые эффекты относительно контроля на более длинных волнах ближнего ИК-диапазона (>800 нм), между собой они на этих длинах волн различались слабее. Это указывает на полезность сопоставления широкополосных и узкополосных спектральных данных. Значимые различия между всеми группами были заметны уже на 20-е сутки, на несколько суток раньше, чем при морфологическом анализе RGB-изображений.
На рис. 4 показана динамика стрессовых вариантов с 20-х по 26-е сутки по отношениям коэффициентов отражения, рассчитанным по гиперспектральным изображениям с использованием значимых длин волн с рис. 3. Это позволяет визуализировать изменения стресса с течением времени. Для сравнения засухи с контролем использовали отношение отражения при 782 и 544 нм, для сравнения засоления с контролем — при 676 и 743 нм. Рассчитанные отношения нанесли на пиксели изображений характерных растений на 20-е, 23-и, 24-е, 25-е и 26-е сутки. В обоих вариантах отличия от контроля видны на 20-е сутки. В целом значения отношения со временем возрастали у растений в условиях стресса и почти не менялись в контроле. В отличие от анализа только 20-х суток (рис. 3), этот метод позволил наблюдать спектральные сдвиги одновременно в пространстве и во времени.
Для оценки радиометрической точности Nano сравнили отражение плоского листа контрольного растения, измеренное контактным спектрометром полного диапазона Analytical Spectral Devices с откалиброванным источником освещения (ASD FS3 350-2500, Боулдер, Колорадо, США), с изображением того же растения, полученным Nano. Результаты двух приборов согласовались (дополнительный файл 2). Это означает, что условия измерения HyperScanner с Nano, включая источник света и калибровочные панели, позволяют получать значения отражения на уровне листа, сопоставимые с результатами прибора с более высоким отношением сигнал/шум (SNR), такого как ASD.
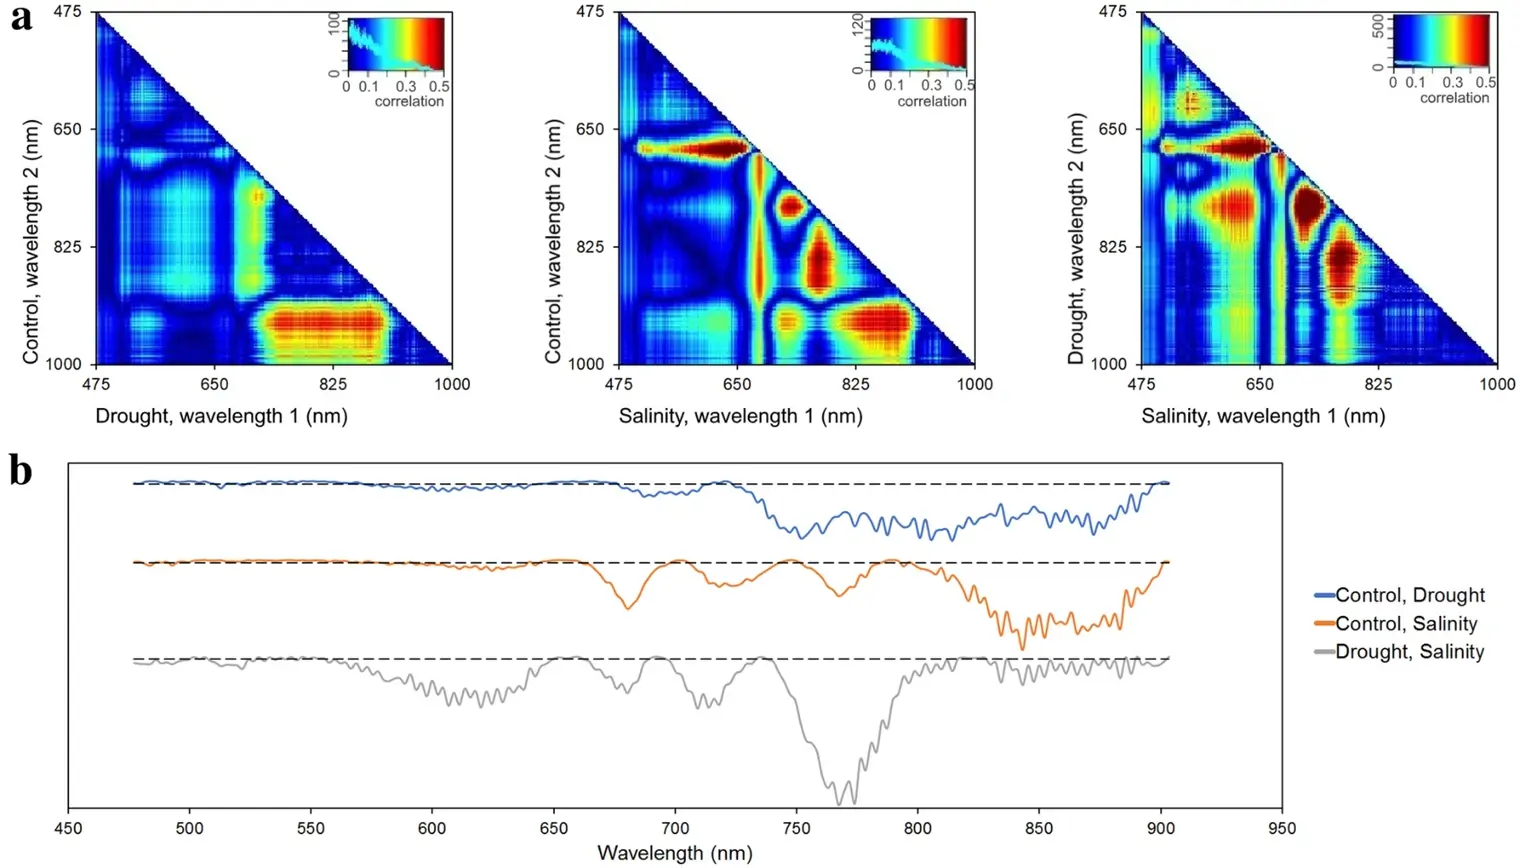
Рис. 3. Анализ отражения на 20-е сутки. a — карты корреляций NDSI при попарном сравнении вариантов. b — результаты t-критерия для каждой длины волны и пары вариантов. Сплошные линии показывают десятичный логарифм p-значений. Пунктирные линии соответствуют порогу статистической значимости log₁₀(p = 0,05). Значения ниже линии указывают на статистически значимые различия.
Обозначения: Wavelength — длина волны, Correlation — корреляция, Control — контроль, Drought — засуха, Salinity — засоление. На панелях a по горизонтали отложена длина волны 1, по вертикали — длина волны 2 (нм).
Обсуждение
В естественных экосистемах растения испытывают разнообразные абиотические стрессы. В агроэкосистемах воздействия среды могут замедлять рост и менять вегетативное и репродуктивное развитие, что часто снижает урожайность. В контролируемых условиях мы воспроизвели распространённые для агроэкосистем стрессы [47], чтобы оценить, насколько HyperScanner пригоден для оперативного мониторинга реакций растений. По мере развития действия засухи и засоления появлялись видимые симптомы (рис. 2a). Мониторинг роста по обычным RGB-фотографиям и статистический анализ извлечённых морфометрических данных позволили определить, когда физиологическое воздействие стресса выражалось в статистически значимом изменении темпов роста листьев по сравнению с контролем. Анализ диаметра и периметра розетки и площади листьев показал, что изменения темпов роста при засухе не достигали статистической значимости до 23-х суток, то есть до истечения четырёх суток после прекращения полива (рис. 2). Внесение 500 мМ солевого раствора подействовало быстрее. При засолении развивался хлороз листьев [48], а статистически значимые изменения их разрастания отмечались на 22-е сутки. При обоих воздействиях статистически значимые изменения роста обнаруживались спустя несколько суток. Вероятно, причина в том, что анализ видимых признаков, таких как рост, слабо выявляет самые ранние стрессовые реакции, которые, скорее всего, связаны с изменением экспрессии генов и биохимии растений [49]. Если растениевод в поле полагался бы только на RGB-фотографии, существенное уменьшение размеров растений и снижение урожайности были бы неизбежны, поскольку эти потери тесно связаны с изменениями, по которым на изображениях выявляют стресс.
Гиперспектральные данные значительно увеличивают объём доступной исследователю информации [50, 51]. RGB-анализ на рис. 2 использует лишь часть информации, которую потенциально даёт гиперспектральная съёмка. Статистический анализ гиперспектральных данных показал значимый стресс задолго до обнаружения изменений роста по RGB. Анализ NDSI на рис. 3a выявил воздействие на растения через сутки после начала стресса.
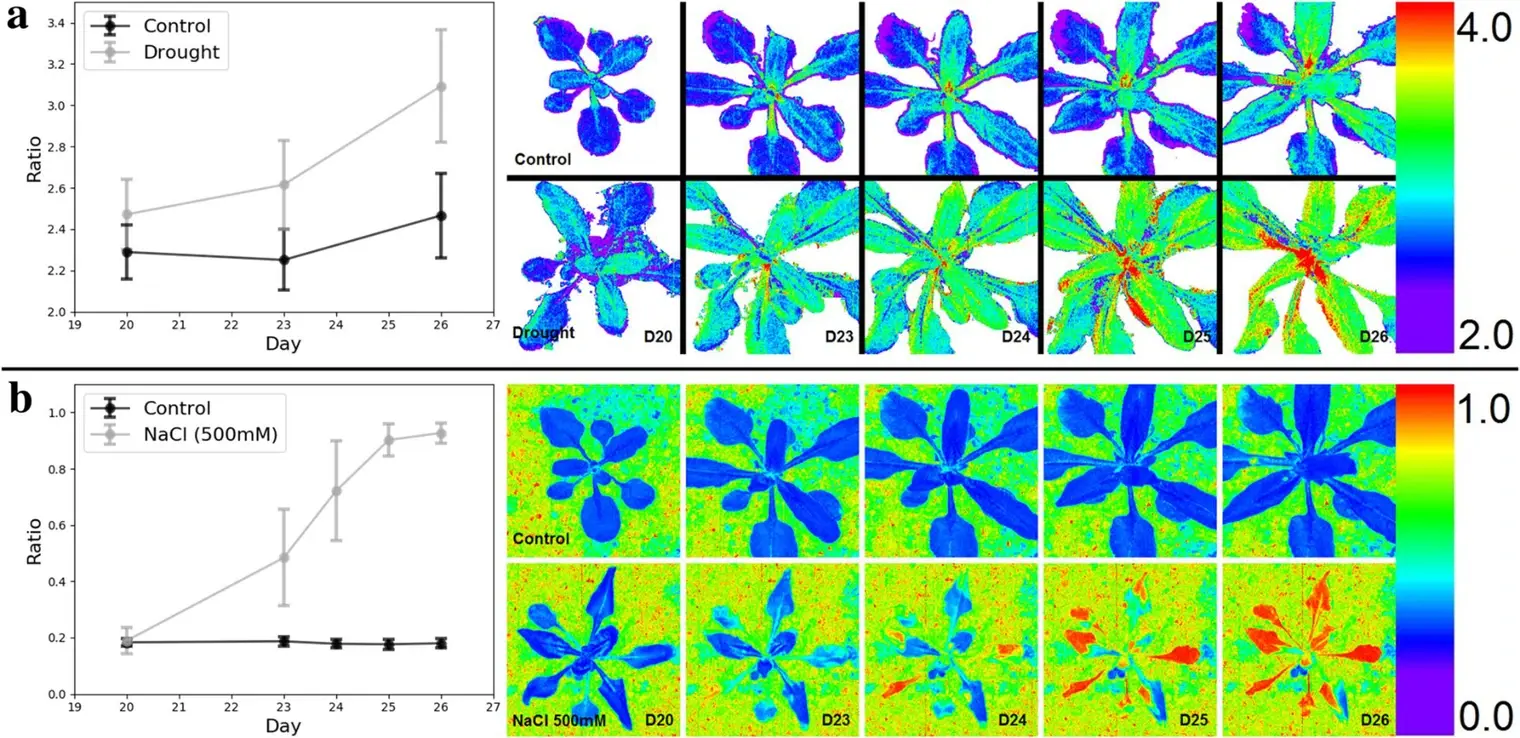
Рис. 4. a — спектральный отклик на засуху. Отношение коэффициентов отражения листьев при 782 и 544 нм (R₇₈₂/R₅₄₄) показано как динамика по выборкам листьев (среднее ± SD) и серия изображений характерных растений контроля и варианта засухи. b — спектральный отклик на солевой стресс. Отношение R₆₇₆/R₇₄₃ показано как динамика по выборкам листьев (среднее ± SD) и серия изображений характерных растений контроля и стрессового варианта. Выбор длин волн для расчёта отношений подтверждается значимыми связями на рис. 3.
Обозначения: Ratio — отношение коэффициентов отражения, Day — сутки, Control — контроль, Drought — засуха. На панели b представлен солевой вариант (500 мМ NaCl). В исходной подписи к панели b стрессовый вариант назван засухой.
При сравнении с контролем эффект засухи был наиболее значим в области от красного края до ближнего ИК-диапазона (примерно 700–900 нм). На тепловой карте сравнения солевого варианта с контролем значимые изменения были сильнее и многочисленнее. Это подкрепляет предположение, что засоление влияло на растения сильнее засухи, по крайней мере по изменениям гиперспектрального сигнала (рис. 2). Сравнение засоления и засухи по NDSI показывает, что через сутки после начала воздействия их эффекты на Arabidopsis были сопоставимыми. На красном крае и в ближнем ИК-диапазоне различия значимы для обоих вариантов при сравнении с контролем, но не между стрессовыми вариантами. Это указывает на изменения в одном диапазоне длин волн и сходной степени. В третьем сравнении по NDSI присутствуют корреляции в диапазонах 580–650 и 750–800 нм, отсутствующие при сравнении с контролем. Это позволяет предположить, что в данных диапазонах стрессовые варианты изменялись по-разному.
Анализ p-значений на рис. 3b выявляет изменения на отдельных длинах волн и подтверждает предположения по тепловым картам NDSI (рис. 3a). Значимые p-значения при сравнении двух стрессовых вариантов в диапазоне 580–640 нм указывают на специфичность изменений для каждого стресса (рис. 3b). При засолении отражение изменялось сильнее, возможно, из-за различий в том, как менялось относительное содержание вспомогательных пигментов, отличных от хлорофилла. Отражение при 600–650 нм менялось при обоих стрессах по сравнению с контролем. При сравнении двух стрессов друг с другом статистические различия были велики, что говорит о гораздо более сильном влиянии засоления на поглощение в красном диапазоне, вероятнее всего связанное с хлорофиллом. Значимость в диапазоне 700–800 нм также подтверждает специфичность корреляций NDSI для разных типов стресса. Засоление сильнее влияло на отражение в области красного края, которое служит показателем общего состояния растений. Попарные t-тесты двух стрессовых вариантов дают выводы, которые невозможно получить одним сравнением с контролем, поскольку позволяют оценивать и различия между стрессами.
Рисунок 3 также позволяет предположить, что в разных условиях растения задействовали разные механизмы реакции. При засухе отражение относительно контроля изменялось около 520–530 нм. Этот интервал близок к каналу фотохимического индекса отражения на 531 нм [10], тесно связанному с содержанием пигментов ксантофиллового цикла, меняющимся при стрессе [11]. При засолении отражение около 520–530 нм существенно не изменилось, что подтверждает вероятную связь этой физиологической реакции именно с засухой. При засолении наблюдались сдвиги ниже 500 нм, отсутствовавшие при засухе. Возможно, они связаны с воздействием на хлорофилл b и каротиноиды, имеющие выраженные полосы поглощения в синей области [52]. Аналогичным образом можно интерпретировать результаты на других длинах волн. В обоих вариантах наиболее значимые изменения наблюдались после 700 нм, вплоть до ближней ИК-области. При 750–800 нм отражение изменилось относительно контроля в обеих группах, причём при засухе сильнее, чем при засолении. Попарные t-тесты подтверждают это, давая на этих длинах волн наименьшие p-значения. Каналы ближнего ИК-диапазона были значимы при обоих стрессах, однако t-критерий при сравнении засухи и засоления показывает небольшую степень значимости. Это свидетельствует о сходном изменении отражения.
Визуализация гиперспектральных изображений на рис. 4 позволяет отслеживать развитие изменений в экспериментах на основе отражения. Поскольку отношения отражения на выбранных длинах волн можно отобразить непосредственно на растении, во времени можно анализировать и пространственные, и спектральные закономерности. Например, изменение отношения при засухе сначала было заметно у основания растения, затем распространялось по стеблю и далее на листья вдоль проводящих тканей (рис. 4a). При солевом стрессе отражение старых листьев изменилось раньше, чем молодых (рис. 4b). Анализ только спектров таких возможностей не даёт.
HyperScanner прост и недорог в изготовлении и подходит для разных растений и экспериментов. Можно сканировать любое растение, которое помещается в рабочую зону и не превышает доступную высоту размещения прибора. Высоту прибора, скорость и маршруты сканирования можно менять под разные виды. Например, кроме Arabidopsis мы успешно сканировали значительно более крупные растения хлопчатника.
HyperScanner также поддерживает разные датчики. Возможность расширения системы для параллельной работы нескольких способов съёмки — один из основных принципов проекта. Профильная система 80/20 и печать креплений под конкретные приборы позволяют быстро подключать новые датчики. В этом исследовании в качестве датчика установили только Nano, чтобы оперативно проверить работоспособность HyperScanner. Заметное ограничение состоит в том, что Nano управляется программой изготовителя, поэтому запуск сканирования несколько усложняется. Полная интеграция Nano в наше программное обеспечение повысит удобство работы.
Сейчас мы внедряем другие датчики, включая лазерный дальномер для измерения высоты растений и компенсации различий по высоте [27]. Розетки Arabidopsis плоские и мало различаются по высоте, поэтому в данном опыте дальномер не требовался. Для более крупных растений с выраженной трёхмерной структурой это будет важным дополнением. Параллельная тепловизионная съёмка позволит оценивать изменения ключевых параметров транспирации и фотосинтетической способности. Лазерный сканер дополнительно позволит оценивать изменения структуры листьев и биомассы в дальнейших опытах [6, 14, 27, 53]. Интеграция этих систем будет описана в будущих работах с HyperScanner.
Наибольший потенциал HyperScanner, вероятно, связан с полной автоматизацией управления и анализа [54]. Система управления переводится с разомкнутой схемы на замкнутую, с внутренними датчиками и обратной связью. Другое перспективное направление — использование нейросетей для классификации растений [55]. Сочетание HyperScanner и нейросетей позволит ещё быстрее получать и классифицировать данные отражения [28, 56]. Автоматическое выявление стресса нейросетью может позволить исследователю поддерживать образцы в здоровом состоянии при минимальном вмешательстве. Полная автоматизация HyperScanner обеспечит высокую эффективность системы [25].
Заключение
HyperScanner разработан для сбора гиперспектральных данных при минимальном участии человека. Система доступна исследователям по стоимости и допускает подключение дополнительных приборов. Программное обеспечение, данные и другие относящиеся к работе файлы доступны открыто по ссылкам в статье. В нескольких опытах мы измеряли абсолютный коэффициент отражения Arabidopsis в условиях стресса. HyperScanner выявил спектральные изменения раньше визуальных наблюдений и показал различия в реакциях на два воздействия. HyperScanner может повысить точность выявления стресса и имеет высокий потенциал для повседневного использования при исследовании растений в разных условиях.
Методы
Условия выращивания Arabidopsis
Растения выращивали в камере с контролируемой средой рядом с HyperScanner. Использовали шесть стандартных посевных кассет 1020 (Greenhouse MegaStore, Данвилл, Иллинойс, США), по 18 растений Arabidopsis Col-0 в почвенной смеси в каждой. Температуру поддерживали на уровне 22 °C, световой и тёмный периоды составляли 18 и 6 ч. Освещение обеспечивали четырёхфутовые люминесцентные лампы (100 мкмоль·м⁻²·с⁻¹). Ежедневно взвешивали горшки и делали RGB-снимки растений. Фенотипическую реакцию оценивали по изображениям камеры Raspberry Pi в Phenotiki [42]. Гиперспектральное сканирование выполняли ежедневно семь суток, начиная с 20-х суток после прорастания. Две кассеты использовали в качестве контроля, поддерживая постоянную доступность воды ежедневным внесением 500 мл. Остальные четыре кассеты распределили между двумя вариантами. Для создания засухи две кассеты не поливали с 19-х суток. В две другие внесли 2 л 500 мМ NaCl для создания солевого стресса. Для уменьшения возможного краевого эффекта следует исключать из анализа крайние растения и обеспечивать равномерное освещение всей кассеты.
Принцип ЧПУ и устройство HyperScanner
HyperScanner основан на технологии ЧПУ [57]. ЧПУ автоматизирует работу станков посредством компьютерного управления, интеллектуальных датчиков и шаговых двигателей. Управляющий компьютер последовательно исполняет команды, рассчитанные на основе пользовательского ввода и физических характеристик станка. Датчики предоставляют информацию алгоритмам управления, а шаговые двигатели задают физическое положение инструментов. Компьютерное управление позволяет заранее определять последовательность операций и перенастраивать команды при внешних изменениях. Такая цифровизация обеспечивает автоматизацию и высокую точность.
HyperScanner может точно перемещаться к точке (X, Y, Z) с заданной пользователем скоростью. Датчик (в нашем случае линейный сканер Nano Hyperspec, см. ниже) закреплён в центральной точке, перемещаемой по осям X, Y и Z. Эта точка перемещается над зоной сканирования, что позволяет снимать расположенные внизу растения. Программа позволяет управлять движением в реальном времени, заранее задавать маршруты и запускать их выполнение.
Формирующий изображение спектрометр Nano Hyperspec
Nano — линейный сканер с построчной схемой съёмки (pushbroom) для диапазона VNIR (400–1000 нм) [58]. Он регистрирует 640 пространственных отсчётов (пикселей) и 270 спектральных каналов. Спектральные отсчёты расположены с шагом 2,2 нм/пиксель. Nano весит 0,544 кг и имеет штатные точки крепления, что делает его подходящим для HyperScanner.
Технические характеристики HyperScanner
HyperScanner разработан для работы на большой площади, изменения скорости сканирования и точного перемещения. Площадь сканирования составляет 2,1 м². Из-за ограничений рабочей скорости Nano сканирование ведётся со скоростью 1 см/с. С другими датчиками она может отличаться, поэтому её можно регулировать в интерфейсе HyperScanner. Поскольку Nano — линейный сканер, длина строки пропорциональна высоте по оси Z. Высоту можно подобрать так, чтобы строка перекрывала габариты образца. В этом опыте для покрытия каждого горшка использовалась строка длиной около 8 см. Технические параметры приведены в табл. 1.
Таблица 1. Технические характеристики HyperScanner.
| Характеристика | Значение в единицах СИ |
|---|---|
| Габариты (Д × Ш × В) | 1,8 × 1,8 × 1,8 м |
| Площадь сканирования / рабочая площадь | 2,1 м² |
| Ход по оси X | 1,35 м |
| Ход по оси Y | 1,55 м |
| Ход по оси Z | 85 см |
| Точность позиционирования | ±0,10 см |
| Оптимальная скорость сканирования | 1 см/с |
| Максимальная безопасная скорость перемещения | 8 см/с |
| Длина строки сканирования с установленным Nano | 0,53–45,55 см |
Конструкция HyperScanner
Рама HyperScanner изготовлена из алюминиевых профилей 80/20 по схеме X-Carve [38]. Подробные инструкции по сборке доступны на сайте X-Carve, однако для нашей задачи внесено много изменений [40, 59]. Трёхмерные модели показаны на рис. 5a и в дополнительном файле 3. По углам машины вертикально расположены четыре профиля по 1,8 м. Они поддерживают ещё восемь профилей по 1,8 м, образующих две горизонтальные секции размером 1,8 × 1,8 м. Нижняя секция поддерживает съёмные платформы для кассет или горшков. Верхняя секция несёт механизм перемещения на шаговых двигателях. Два шаговых двигателя закреплены на металлических боковых пластинах, установленных на несущих профилях верхней секции (рис. 5a, дополнительный файл 3). Ролики на пластинах с двигателями позволяют им перемещаться вдоль двух профилей верхней секции по оси Y. Между пластинами находится направляющая оси X. По ней на роликах перемещается металлическая каретка, на которой закреплён линейный привод оси Z. Оси X и Y имеют ремённый привод, ось Z — червячный. Nano и осветители установлены на нижнем конце линейного привода с помощью специально изготовленных креплений. Крепления и дополнительные опорные кронштейны спроектированы в SolidWorks под конкретное оборудование. Их напечатали из PLA на 3D-принтере с открытой документацией LulzBot TAZ 5 (Aleph Objects, Inc., Ловленд, Колорадо, США). Все файлы SolidWorks доступны по адресу https://doi.org/10.7910/DVN/9DLR7S. В ведомости материалов (дополнительный файл 4) перечислены все материалы для сборки HyperScanner. Инструменты в неё не включены.
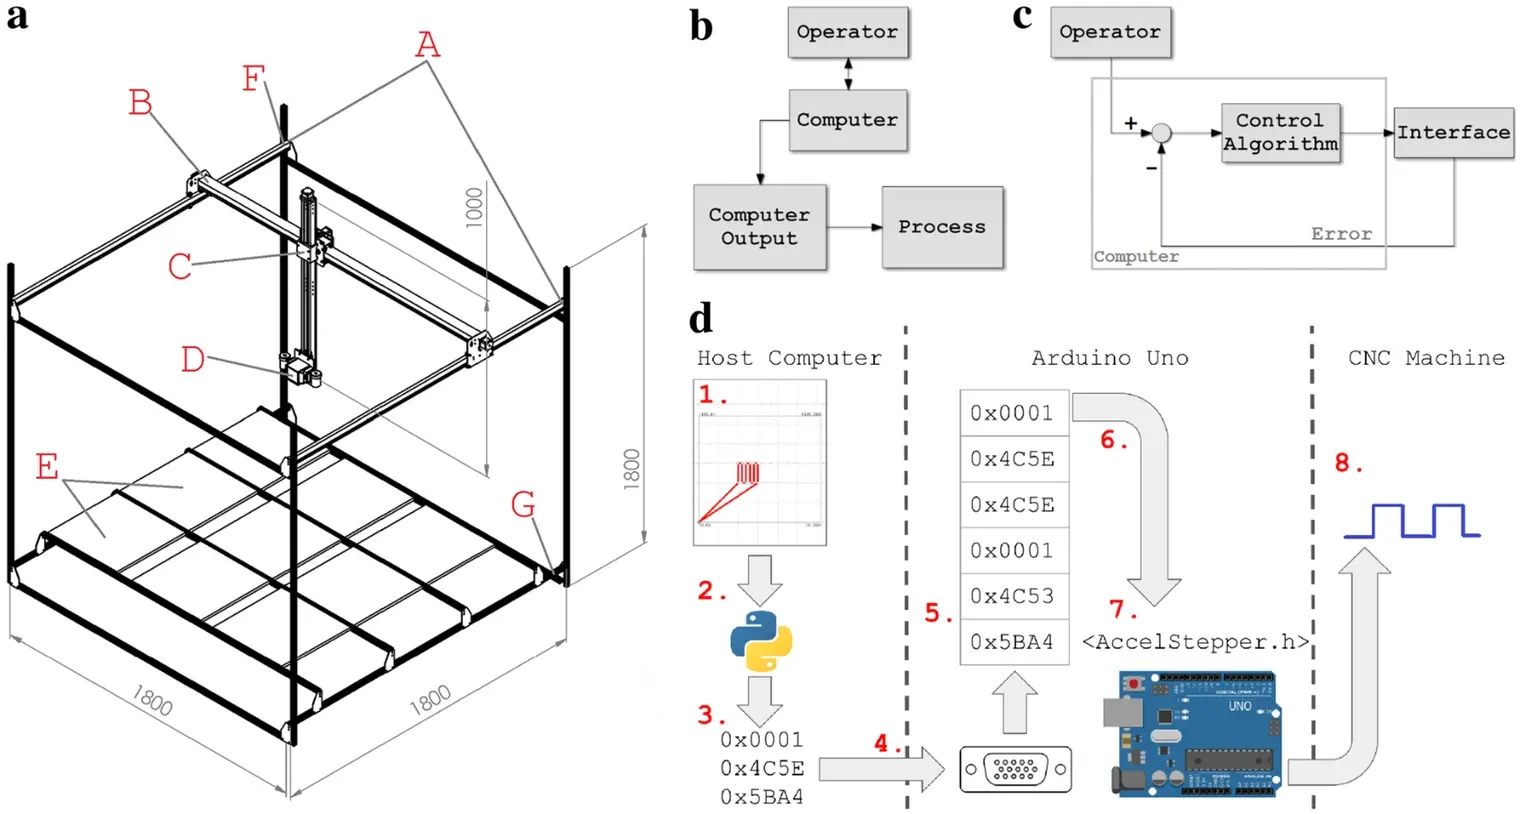
Рис. 5. a — изометрический вид HyperScanner. A — направляющие оси Y, B — направляющая оси X, C — линейный привод оси Z, D — Nano Hyperspec, E — кассеты с растениями, F — верхняя секция, G — нижняя секция. Схемы управления HyperScanner и станков с ЧПУ: b — разомкнутое управление, c — замкнутое управление. d — передача данных от пользователя к HyperScanner. (1) Пользователь рисует маршрут сканирования во встроенной веб-форме. (2) Точки маршрута передаются в формате ASCII сценарию Python 3 через CEFPython. (3) Сценарий Python 3 преобразует ASCII-координаты в двоичные кортежи команд Arduino. (4) Двоичные кортежи передаются от управляющего компьютера к Arduino через UART. (5) По мере поступления через UART команды помещаются в очередь FIFO в памяти Arduino. (6) После завершения предыдущей команды следующая извлекается из очереди и вызываются функции AccelStepper. (7) AccelStepper рассчитывает сигнал, необходимый для перемещения шаговых двигателей. (8) Сигнал передаётся на gShield через выводы GPIO Arduino.
Обозначения: Operator — оператор, Computer — компьютер, Computer Output — выходной сигнал компьютера, Process — управляемый процесс, Control Algorithm — алгоритм управления, Interface — интерфейс, Error — сигнал ошибки, Host Computer — управляющий компьютер, CNC Machine — станок с ЧПУ.
Управление и электрические подключения
Алгоритмы большинства станков с ЧПУ делятся на разомкнутое управление и замкнутое управление с обратной связью. При разомкнутом управлении процесс линеен: компьютер принимает ввод оператора и выдаёт сигнал управления системой. Базовая схема приведена на рис. 5b [57]. В замкнутой схеме датчики передают информацию по обратной связи, что повышает степень автоматизации (рис. 5c). В HyperScanner реализовано разомкнутое управление.
В HyperScanner используются четыре шаговых двигателя и один линейный привод. По оси X работают два двигателя, по оси Y — один, по оси Z — один двигатель и линейный привод для точного вертикального позиционирования. В будущем мы намерены внедрить обратную связь для более надёжного и полностью автоматизированного управления.
Базовая схема электрических подключений приведена в дополнительном файле 5. Компьютер принимает команды пользователя и преобразует их в перемещения шаговых двигателей по схеме на рис. 5b. Собственная программа передаёт команды с компьютера на Arduino, затем на gShield. gShield — драйвер шаговых двигателей, который при получении корректно сформированных команд подаёт на двигатели необходимую мощность. Arduino питается от компьютера через USB, по которому также осуществляется последовательная связь. Шаговые двигатели, gShield, Nano и осветители питаются от источника постоянного тока с цифровым управлением. Специализированный источник питания не предусмотрен, поскольку масса и энергетическая нагрузка на линейном приводе меняются при добавлении устройств. Поэтому параметры питания приходится регулировать.
Освещение
Крепления осветителей и Nano изготовили на 3D-принтере. Крепления рассчитаны на 20-ваттные галогенные лампы MR11 (Simba Lighting, Торранс, Калифорния), которые работают на мощности, близкой к максимальной номинальной. Осветители расположены параллельно строке сканирования Nano для максимально равномерного освещения. Крепления установлены на конце оси Z, поэтому условия освещения при движении сканера не меняются. Крепления также соединены с профилями 80/20, скользящими вдоль привода оси Z, чтобы регулировать высоту относительно образцов.
Поскольку HyperScanner работает в помещении, искусственное освещение было одним из основных факторов при разработке. Осветители и крепления последовательно модифицировали до получения конфигурации, обеспечивавшей равномерное и стабильное освещение на протяжении каждого сканирования. Эту задачу облегчила возможность заменять осветители и регулировать их мощность и положение.
Программное обеспечение
Для HyperScanner разработали набор программных инструментов для непосредственного взаимодействия с оборудованием и выполнения пользовательских операций более высокого уровня. Инструменты под названием Ardupy опубликованы на странице GitHub группы EnSpec Висконсинского университета (https://github.com/EnSpec/Plant_CNC_Controller) и в Zenodo (https://doi.org/10.5281/zenodo.1406721) [60]. Ardupy преобразует команды перемещения, приходящие через последовательный USB-порт Arduino Uno, в соответствующие команды gShield. Непосредственный обмен с gShield обеспечивает библиотека Arduino AccelStepper [61]. AccelStepper управляет выходами общего назначения GPIO, необходимыми для перемещения шагового двигателя в абсолютную позицию с заданной скоростью. Пользователь управляет AccelStepper через собственный набор команд, которыми компьютер и Arduino обмениваются по последовательному соединению UART (универсальный асинхронный приёмопередатчик). Команды кодируются тройками 32-битных целых чисел, задающих значения и параметры AccelStepper. Полный набор приведён в табл. 2. Чтобы входящие команды не прерывали уже запущенные, их по мере поступления через UART помещают в очередь FIFO («первым пришёл — первым вышел») и извлекают по завершении предыдущей команды. В текущей версии программы очередь реализована библиотекой Arduino QueueList [62]. Передача данных между компьютером и станком с ЧПУ показана на рис. 5d.
Для создания маршрутов сканирования разработан графический интерфейс Ardupy-GUI, упрощающий работу с установкой. Вводить значения через консоль необязательно: в Ardupy-GUI есть панель управления с прямым доступом к каждой из перечисленных команд и редактор маршрутов, где траектории можно рисовать мышью или задавать с клавиатуры (дополнительный файл 6). Редактор формирует последовательности команд по созданным маршрутам. Для серверной части интерфейса выбрали CEFPython — набор привязок Python 3 для Chromium Embedded Framework, позволяющий быстро разрабатывать кроссплатформенные графические приложения [63, 64]. CEFPython связывает встроенный браузер, отображающий интерфейс, со сценарием Python 3, который обеспечивает связь компьютера с Arduino HyperScanner. Библиотека JavaScript jQuery связывает действия пользователя с вызовами функций в сценарии Python 3 [65]. Редактор маршрутов реализован на d3.js, библиотеке для работы с масштабируемой векторной графикой [66]. Сценарий Python 3 формирует двоичные команды из текстовых данных, введённых в интерфейсе, и передаёт их в Arduino HyperScanner по UART через модуль PySerial [67].
Таблица 2. Набор команд, поддерживаемых программой Arduino.
| Команда | Байты 0–4 | Байты 4–8 | Байты 8–12 |
|---|---|---|---|
| Переместить оси X и Y в абсолютную позицию | 1 | Позиция X в шагах | Позиция Y в шагах |
| Задать задержку между перемещениями | 2 | Задержка в миллисекундах | 0 |
| Переместить оси X и Y на заданное число шагов | 3 | Изменение позиции X в шагах | Изменение позиции Y в шагах |
| Переместить ось Z в абсолютную позицию | 4 | Позиция Z в шагах | 0 |
| Переместить ось Z на заданное число шагов | 5 | Изменение позиции Z в шагах | 0 |
| Задать скорость перемещения | 6 | Скорость в шагах в секунду | 0 |
Порядок эксплуатации
После создания маршрутов и настройки параметров прибора эксплуатация HyperScanner несложна (дополнительный файл 7). Сначала Nano устанавливают в крепление и подключают к компьютеру. Высоту сканирования, скорость и длину строки рассчитывают отдельно по полю зрения и времени интегрирования Nano. В этом эксперименте время интегрирования составляло 14 мс. После включения источника питания и осветителей и запуска Ardupy Nano перемещают к белой панели и калибруют. Выбирают маршрут и размещают растения в предусмотренных им позициях. После начальной настройки Nano переводят в режим съёмки и запускают маршрут. Сканирование двух кассет по 18 растений занимает менее пяти минут. По завершении можно перенести файлы с Nano либо загрузить другие маршруты и образцы. Для обработки изображения необходимо включить в съёмку белую панель. После сканирования всех растений можно приступать к обработке изображений.
При настройке оборудования необходимо проверить, не требуется ли подтянуть ремни приводов. От правильного натяжения зависит качество перемещения сканера, поэтому проверка важна. Необходимость повторного натяжения возникает редко.
Обработка изображений
Гиперспектральные изображения обрабатывали в ENVI 5.0 (Exelis Visual Information Solutions, Inc., Боулдер, Колорадо, США). На каждом изображении присутствовала откалиброванная панель Spectralon с коэффициентом отражения 99 % (Labsphere, Норт-Саттон, Нью-Гэмпшир, США). Её использовали для расчёта отражения и оценки уровня шума изображения. Критерием отбора длин волн с высоким SNR служил коэффициент вариации (CV). По изображению белой панели вычислили CV вдоль направления сканирования и для дальнейшего анализа отобрали диапазон 477,1–903,42 нм с низким CV. Эталонный спектр энергетической яркости белой панели для всего изображения оценили по вертикальной строке сканирования панели Spectralon с максимальной медианной яркостью. В анализ включили все пиксели растений, выделив области интереса в ENVI. Пространственные и спектральные края гиперспектрального куба исключили, чтобы уменьшить влияние эффектов smile и keystone, например изменения центральных длин волн поперёк траектории сканирования [68]. Относительный коэффициент отражения рассчитывали по формуле:

Здесь i и j — строка и столбец пикселя, k — длина волны. DNᵢ,ⱼ обозначает спектр энергетической яркости пикселя, DN белой панели — спектр энергетической яркости эталонной панели. Расчёт выполняется отдельно для каждой длины волны.
Нормализованный разностный спектральный индекс
Нормализованные разностные спектральные индексы рассчитали для всех 270 спектральных каналов Nano. Разность коэффициентов отражения для пары каналов, например i и j, делили на их сумму:

Для каждой пары индексы рассчитали для выборки из n = 2000 пикселей. Затем для каждой комбинации NDSI выполнили статистические тесты и построили тепловые карты по их результатам.
Дополнительные файлы
Дополнительный файл 1. Ежедневные измерения влажности кассет, их массы и температуры воздуха при выращивании Arabidopsis в контролируемых условиях. Линейный график электропроводности почвы в процентах, используемой как косвенный показатель влажности. График с заливкой, показывающий массу кассеты как косвенный показатель содержания воды. Линейный график средней температуры (22 ± 2 °C).
Дополнительный файл 2. Кривые отражения одного контрольного растения Arabidopsis, полученные приборами ASD и Nano.
Дополнительный файл 3. Три дополнительных вида HyperScanner.
Дополнительный файл 4. Ведомость материалов для сборки HyperScanner. Инструменты в ней не указаны.
Дополнительный файл 5. Базовая схема электрических подключений HyperScanner. Каждая стрелка обозначает проводное подключение: A — внешний пользовательский ввод, B — данные от Nano, C — управляющий сигнал Nano, D — координаты от Ardupy, E — питание драйвера gShield, F — питание шаговых двигателей, G — питание Nano, H — источник питания, I — Arduino Uno, J — драйвер gShield, K — шаговые двигатели.
Дополнительный файл 6. Снимки экрана меню ручного управления и редактора маршрутов Ardupy. HyperScanner можно управлять вручную или создавать траектории, перетаскивая точки на панели карты.
Дополнительный файл 7. Блок-схема порядка эксплуатации HyperScanner.
Сокращения
CNC — числовое программное управление (ЧПУ), Nano — Headwall Photonics Nano Hyperspec, VNIR — видимый и ближний инфракрасный диапазоны, RGB — красный, зелёный и синий каналы, NDSI — нормализованный разностный спектральный индекс, ASD — Analytical Spectral Devices, SNR — отношение сигнал/шум, USB — универсальная последовательная шина, GPIO — ввод-вывод общего назначения, UART — универсальный асинхронный приёмопередатчик, FIFO — очередь «первым пришёл — первым вышел», GUI — графический интерфейс пользователя, CV — коэффициент вариации.
Вклад авторов
ML собрал установку, провёл эксперименты и подготовил первый вариант рукописи. RG спроектировал детали в SolidWorks и подготовил чертежи. MW разработал специализированное программное обеспечение. ZY обработал изображения и предоставил полученные данные. RB и SG спланировали эксперименты по стрессу растений. AS разработал концепцию установки и участвовал в первоначальной разработке методов анализа. PT предоставил приборы и техническую поддержку и руководил количественным анализом спектральных данных. PT, RB и SG участвовали в написании статьи и анализе данных. Все авторы прочитали и одобрили окончательную рукопись.
Сведения об авторах
¹ Russell Labs, Висконсинский университет в Мадисоне, 1630 Linden Drive, Мадисон, WI 53706, США. ² Birge Hall, Висконсинский университет в Мадисоне, 430 Lincoln Drive, Мадисон, WI 53706, США. ³ Frazier Rogers Hall, 1741 Museum Road, Гейнсвилл, FL 32611, США.
Благодарности
Работа выполнена в Лаборатории экологической спектроскопии Висконсинского университета. Авторы благодарят Katie Gold за помощь в построении тепловых карт NDSI и Ting Zheng за обсуждение методов статистического анализа. Clayton Kingdon консультировал авторов на раннем этапе разработки прототипа. Авторы также благодарят Amanda Gevens и Paul Bethke за содействие в получении первоначальной финансовой поддержки.
Конфликт интересов
Авторы заявляют об отсутствии конфликта интересов.
Доступность данных и материалов
Наборы данных, подтверждающие выводы статьи, доступны в репозитории CyVerse (https://de.cyverse.org/de/?type=data&folder=/iplant/home/elytas/experiment_repository). Файлы моделей для 3D-печати доступны в Harvard Dataverse (https://doi.org/10.7910/DVN/9DLR7S). Ardupy опубликован на GitHub (https://github.com/EnSpec/Plant_CNC_Controller) и архивирован в Zenodo (https://doi.org/10.5281/zenodo.1406721).
Согласие на публикацию
Все авторы согласны на публикацию статьи.
Этическое одобрение и согласие на участие
Исследование проводилось без участия людей.
Финансирование
Работа профинансирована посредством поддержки PT со стороны Wisconsin Potato Industry Board, гранта USDA-NIFA-SCRI 2011-51181-30629, Колледжа сельскохозяйственных наук и наук о жизни Висконсинского университета в Мадисоне, гранта Hatch WIS01874 и гранта NASA NNX15AN25G. SG и RB получили поддержку по грантам NASA NNX14AT25G и NNX17AD52G и гранту NSF IOS-1557899.
Примечание издателя
Springer Nature придерживается нейтральной позиции в отношении юрисдикционных притязаний на опубликованных картах и в указанных организациях.
Рукопись получена 25 октября 2018 г. и принята 21 января 2019 г.
Список литературы
[1] Pieruschka R, Poorter H. Phenotyping plants: genes, phenes and machines. Funct Plant Biol. 2012;39:813–20.
[2] Fiorani F, Schurr U. Future scenarios for plant phenotyping. Annu Rev Plant Biol. 2013;64:267–91.
[3] Curran PJ. Remote sensing of foliar chemistry. Remote Sens Environ. 1989;30:271–8.
[4] Ustin SL, Gitelson AA, Jacquemoud S, Schaepman ME, Asner GP, Gamon JA, et al. Retrieval of folair information about plant pigment systems from high resolution spectroscopy. Remote Sens Environ. 2009;113:S67–77.
[5] Matsuda O, Tanaka A, Fujita T, Iba K. Hyperspectral imaging techniques for rapid identification of Arabidopsis mutants with altered leaf pigment status. Plant Cell Physiol. 2012;53:1154–70.
[6] Humplík JF, Lazár D, Husičková A, Spíchal L. Automated phenotyp- ing of plant shoots using imaging methods for analysis of plant stress responses—a review. Plant Methods. 2015;11:1–10.
[7] Serbin SP, Singh A, Desai AR, Dubois SG, Jablonski AD, Kingdon CC, et al. Remotely estimating photosynthetic capacity, and its response to tem- perature, in vegetation canopies using imaging spectroscopy. Remote Sens Environ. 2015;167:78–87.
[8] Singh A, Serbin SP, McNeil BE, Kingdon CC, Townsend PA. Imaging spec- troscopy algorithms for mapping canopy foliar chemical and morpho- logical traits and their uncertainties. Ecol Appl. 2015;25:2180–97.
[9] Asner GP, Martin RE, Anderson CB, Knapp DE. Quantifying forest canopy traits: imaging spectroscopy versus field survey. Remote Sens Environ. 2015;158:15–27.
[10] Gamon JA, Serrano L, Surfus JS. The photochemical reflectance index: an optical indicator of photosynthetic radiation use efficiency across species, functional types, and nutrient levels. Oecologia. 1997;112:492–501.
[11] Garbulsky MF, Peñuelas J, Gamon J, Inoue Y, Filella I. The photochemi- cal reflectance index (PRI) and the remote sensing of leaf, canopy and ecosystem radiation use efficiencies: a review and meta-analysis. Remote Sens Environ. 2011;115:281–97.
[12] Suárez L, Zarco-Tejada PJ, González-Dugo V, Berni JAJ, Fereres E. The photochemical reflectance index (PRI) as a water stress indicator in peach orchards from remote sensing imagery. Acta Hortic. 2012;962:363–70.
[13] Sarlikioti V, Driever SM, Marcelis LFM. Photochemical reflectance index as a mean of monitoring early water stress. Ann Appl Biol. 2010;157:81–9.
[14] Kuska MT, Mahlein AK. Aiming at decision making in plant disease pro- tection and phenotyping by the use of optical sensors. Eur J Plant Pathol. 2018;5:5. https://doi.org/10.1007/s10658-018-1464-1.
[15] Wahabzada M, Mahlein AK, Bauckhage C, Steiner U, Oerke EC, Kersting K. Plant phenotyping using probabilistic topic models: uncovering the hyperspectral language of plants. Sci Rep. 2016;6:1–11.
[16] Kolukisaoglu Ü, Thurow K. Future and frontiers of automated screening in plant sciences. Plant Sci. 2010;178:476–84.
[17] Walter A, Studer B, Kölliker R. Advanced phenotyping offers oppor- tunities for improved breeding of forage and turf species. Ann Bot. 2012;110:1271–9.
[18] Virlet N, Sabermanesh K, Sadeghi-Tehran P, Hawkesford MJ. Field scana- lyzer: an automated robotic field phenotyping platform for detailed crop monitoring. Funct Plant Biol. 2017;44:143–53.
[19] Li L, Zhang Q, Huang D. A review of imaging techniques for plant pheno- typing. Sensors (Switzerland). 2014;14:20078–111.
[20] Arvidsson S, Pérez-Rodríguez P, Mueller-Roeber B. A growth phenotyping pipeline for Arabidopsis thaliana integrating image analysis and rosette area modeling for robust quantification of genotype effects. New Phytol. 2011;191:895–907.
[21] Fanourakis D, Briese C, Max JFJ, Kleinen S, Putz A, Fiorani F, et al. Rapid determination of leaf area and plant height by using light curtain arrays in four species with contrasting shoot architecture. Plant Methods. 2014;10:1–11.
[22] Tisné S, Serrand Y, Bach L, Gilbault E, Ben Ameur R, Balasse H, et al. Phe- noscope: an automated large-scale phenotyping platform offering high spatial homogeneity. Plant J. 2013;74:534–44.
[23] Liebisch F, Kirchgessner N, Schneider D, Walter A, Hund A. Remote, aerial phenotyping of maize traits with a mobile multi-sensor approach. Plant Methods. 2015;11:9.
[24] Berni JAJ, Zarco-Tejada PJ, Suárez L, González-Dugo V, Fereres E. Remote sensing of vegetation from UAV platforms using lightweight multispec- tral and thermal imaging sensors. Int Arch Photogramm Remote Sens Spat Inform Sci. 2009;38:6.
[25] Atkinson JA, Pound MP, Bennett MJ, Wells DM. Uncovering the hidden half of plants using new advances in root phenotyping. Curr Opin Bio- technol. 2019;55:1–8.
[26] Gamon JA, Cheng Y, Claudio H, MacKinney L, Sims DA. A mobile tram system for systematic sampling of ecosystem optical properties. Remote Sens Environ. 2006;103:246–54.
[27] Araus JL, Cairns JE. Field high-throughput phenotyping: the new crop breeding frontier. Trends Plant Sci. 2014;19:52–61.
[28] Minervini M, Scharr H, Tsaftaris SA. Image analysis: the new bottleneck in plant phenotyping. IEEE Signal Process Mag. 2015;32:126–31.
[29] LemnaTec. https://www.lemnatec.com/. Accessed 20 Oct 2018.
[30] Pereyra-Irujo GA, Gasco ED, Peirone LS, Aguirrezábal LAN. GlyPh: a low- cost platform for phenotyping plant growth and water use. Funct Plant Biol. 2012;39:905–13.
[31] Jansen M, Gilmer F, Biskup B, Nagel KA, Rascher U, Fischbach A, et al. Simultaneous phenotyping of leaf growth and chlorophyll fluorescence via Growscreen Fluoro allows detection of stress tolerance in Arabidopsis thaliana and other rosette plants. Funct Plant Biol. 2009;36:902–14.
[32] Bergsträsser S, Fanourakis D, Schmittgen S, Cendrero-Mateo MP, Jansen M, Scharr H, et al. HyperART: non-invasive quantification of leaf traits using hyperspectral absorption-reflectance-transmittance imaging. Plant Methods. 2015;11:1–17.
[33] Granier C, Aguirrezabal L, Chenu K, Cookson SJ, Dauzat M, Hamard P, et al. PHENOPSIS, an automated platform for reproducible phenotyping of plant responses to soil water deficit in Arabidopsis thaliana permitted the identification of an accession with low sensitivity to soil water deficit. New Phytol. 2005;169:623–35.
[34] Nuñez I, Matute T, Herrera R, Keymer J, Marzullo T, Rudge T, et al. Low cost and open source multi-fluorescence imaging system for teaching and research in biology and bioengineering. PLoS ONE. 2017;12:1–21.
[35] Green JM, Appel H, Rehrig EM, Harnsomburana J, Chang JF, Balint-Kurti P, et al. PhenoPhyte: a flexible affordable method to quantify 2D pheno- types from imagery. Plant Methods. 2012;8:1–12.
[36] Dobrescu A, Scorza LCT, Tsaftaris SA, McCormick AJ. A“Do-It-Yourself” phenotyping system: measuring growth and morphology throughout the diel cycle in rosette shaped plants. Plant Methods. 2017;13:1–12.
[37] Open-source Lab. http://www.appropedia.org/Open-source_Lab.Accessed 20 Oct 2018.
[38] X-Carve. https://www.inventables.com/technologies/x-carve. Accessed 22 Oct 2018.
[39] Katz R. Design principles of reconfigurable machines. Int J Adv Manuf Technol. 2007;34:430–9.
[40] Mehrabi MG, Ulsoy AG, Koren Y, Heytler P. Trends and perspectives in flexible and reconfigurable manufacturing systems. J Intell Manuf. 2002;13:135–46.
[41] Julkowska MM, Klei K, Fokkens L, Haring MA, Schranz ME, Testerink C. Natural variation in rosette size under salt stress conditions corresponds to developmental differences between Arabidopsis accessions and allelic variation in the LRR-KISS gene. J Exp Bot. 2016;67:2127–38.
[42] Minervini M, Giuffrida MV, Perata P, Tsaftaris SA. Phenotiki: an open software and hardware platform for affordable and easy image-based phenotyping of rosette-shaped plants. Plant J. 2017;90:204–16.
[43] Katori T, Ikeda A, Iuchi S, Kobayashi M, Shinozaki K, Maehashi K, et al. Dissecting the genetic control of natural variation in salt tolerance of Arabidopsis thaliana accessions. J Exp Bot. 2010;61:1125–38.
[44] Römer C, Wahabzada M, Ballvora A, Pinto F, Rossini M, Panigada C, et al. Early drought stress detection in cereals: simplex volume maximisation for hyperspectral image analysis. Funct Plant Biol. 2012;39:878–90.
[45] Yao R, Yang J, Wu D, Xie W, Gao P, Jin W. Digital mapping of soil salinity and crop yield across a coastal agricultural landscape using repeated electromagnetic induction (EMI) surveys. PLoS ONE. 2016;11:1–20.
[46] Roy SJ, Negrão S, Tester M. Salt resistant crop plants. Curr Opin Biotechnol. 2014;26:115–24.
[47] Hu Y, Schmidhalter U. Drought and salinity: a comparison of their effects on mineral nutrition of plants. J Plant Nutr Soil Sci. 2005;168:541–9.
[48] Apse MP, Aharon GS, Snedden WA, Blumwald E. Salt tolerance conferred by overexpression of a vacuolar Na+ /H+ antiport in Arabidopsis. Science. 1999;285:1256–8.
[49] Chaerle L, Van Der Straeten D. Imaging techniques and the early detec- tion of plant stress. Trends Plant Sci. 2000;5:495–501.
[50] Schimel DS, Asner GP, Moorcroft P. Observing changing ecological diver- sity in the Anthropocene. Front Ecol Environ. 2013;11:129–37.
[51] Thompson DR, Boardman JW, Eastwood ML, Green RO. A large airborne survey of Earth’s visible-infrared spectral dimensionality. Opt Express. 2017;25:9186.
[52] Parida AK, Das AB. Salt tolerance and salinity effects on plants: a review. Ecotoxicol Environ Saf. 2005;60:324–49.
[53] Chaerle L, Pineda M, Romero-Aranda R, Van Der Straeten D, Barón M. Robotized thermal and chlorophyll fluorescence imaging of pepper mild mottle virus infection in Nicotiana benthamiana. Plant Cell Physiol. 2006;47:1323–36.
[54] Xu XW, Newman ST. Making CNC machine tools more open, inter- operable and intelligent—a review of the technologies. Comput Ind. 2006;57:141–52.
[55] Taghavi Namin S, Esmaeilzadeh M, Najafi M, Brown TB, Borevitz JO. Deep phenotyping: deep learning for temporal phenotype/genotype clas- sification. Plant Methods. 2018;14:1–14.
[56] Vijayarangan S, Sodhi P, Kini P, Bourne J, Sun H, Poczos B, et al. High- throughput robotic phenotyping of energy sorghum crops. F Serv Robot. 2017;5:1–14.
[57] Bollinger JG, Duffie NA. computer control of machines and processes. 1st ed. Boston: Addison-Wesley Longman Publishing Co., Inc.; 1988.
[58] Headwall Photonics Hyperspectral Imaging Sensors. http://www.headwallphotonics.com/hyperspectral-sensors. Accessed 20 Oct 2018.
[59] X-Carve Instructions. http://x-carve-instructions.inventables.com/1000mm/. Accessed 24 Oct 2018.
[60] Zenodo Archive of Ardupy. https://zenodo.org/record/1406721. Accessed 30 Aug 2018.
[61] McCauley, M. AccelStepper Library for Arduino. http://www.airspayce.com/mikem/arduino/AccelStepper/. Accessed 20 Oct 2018.
[62] Chatzikyriakidis, E. QueueList Library for Arduino. https://playground.arduino.cc/Code/QueueList. Accessed 20 Oct 2018.
[63] Tomczak, C. CEF Python. https://github.com/cztomczak/cefpython.Accessed 20 Oct 2018.
[64] Greenblatt, M. Chromium embedded framework. https://bitbucket.org/chromiumembedded/cef. Accessed 20 Oct 2018.
[65] The jQuery Foundation. https://jquery.org/. Accessed 20 Oct 2018.
[66] Bostock, M. d3.js Library. https://d3js.org/. Accessed 20 Oct 2018.
[67] Liechiti, C. PySerial module. https://pythonhosted.org/pyserial/. Accessed 20 Oct 2018.
[68] Mouroulis P, Green RO, Chrien TG. Design of pushbroom imaging spec- trometers for optimum recovery of spectroscopic and spatial informa- tion. Appl Opt. 2000;39:2210.
Информация издателя BMC
Готовы подать свою работу? BMC предлагает удобную и быструю онлайн-подачу, тщательное рецензирование опытными исследователями в вашей области, оперативную публикацию после принятия статьи и поддержку размещения исследовательских данных, включая крупные и сложные наборы. Публикация по золотому пути открытого доступа способствует расширению сотрудничества и росту цитируемости. Работы получают широкую видимость: сайт набирает свыше 100 млн просмотров в год. В BMC исследования всегда продолжаются. Подробнее: biomedcentral.com/submissions.
20 ноября 2026